Dashboard overview
What each number on the main dashboard means.
The dashboard is the first thing you see after signing in. It's a summary of the last 30 days, not all time.
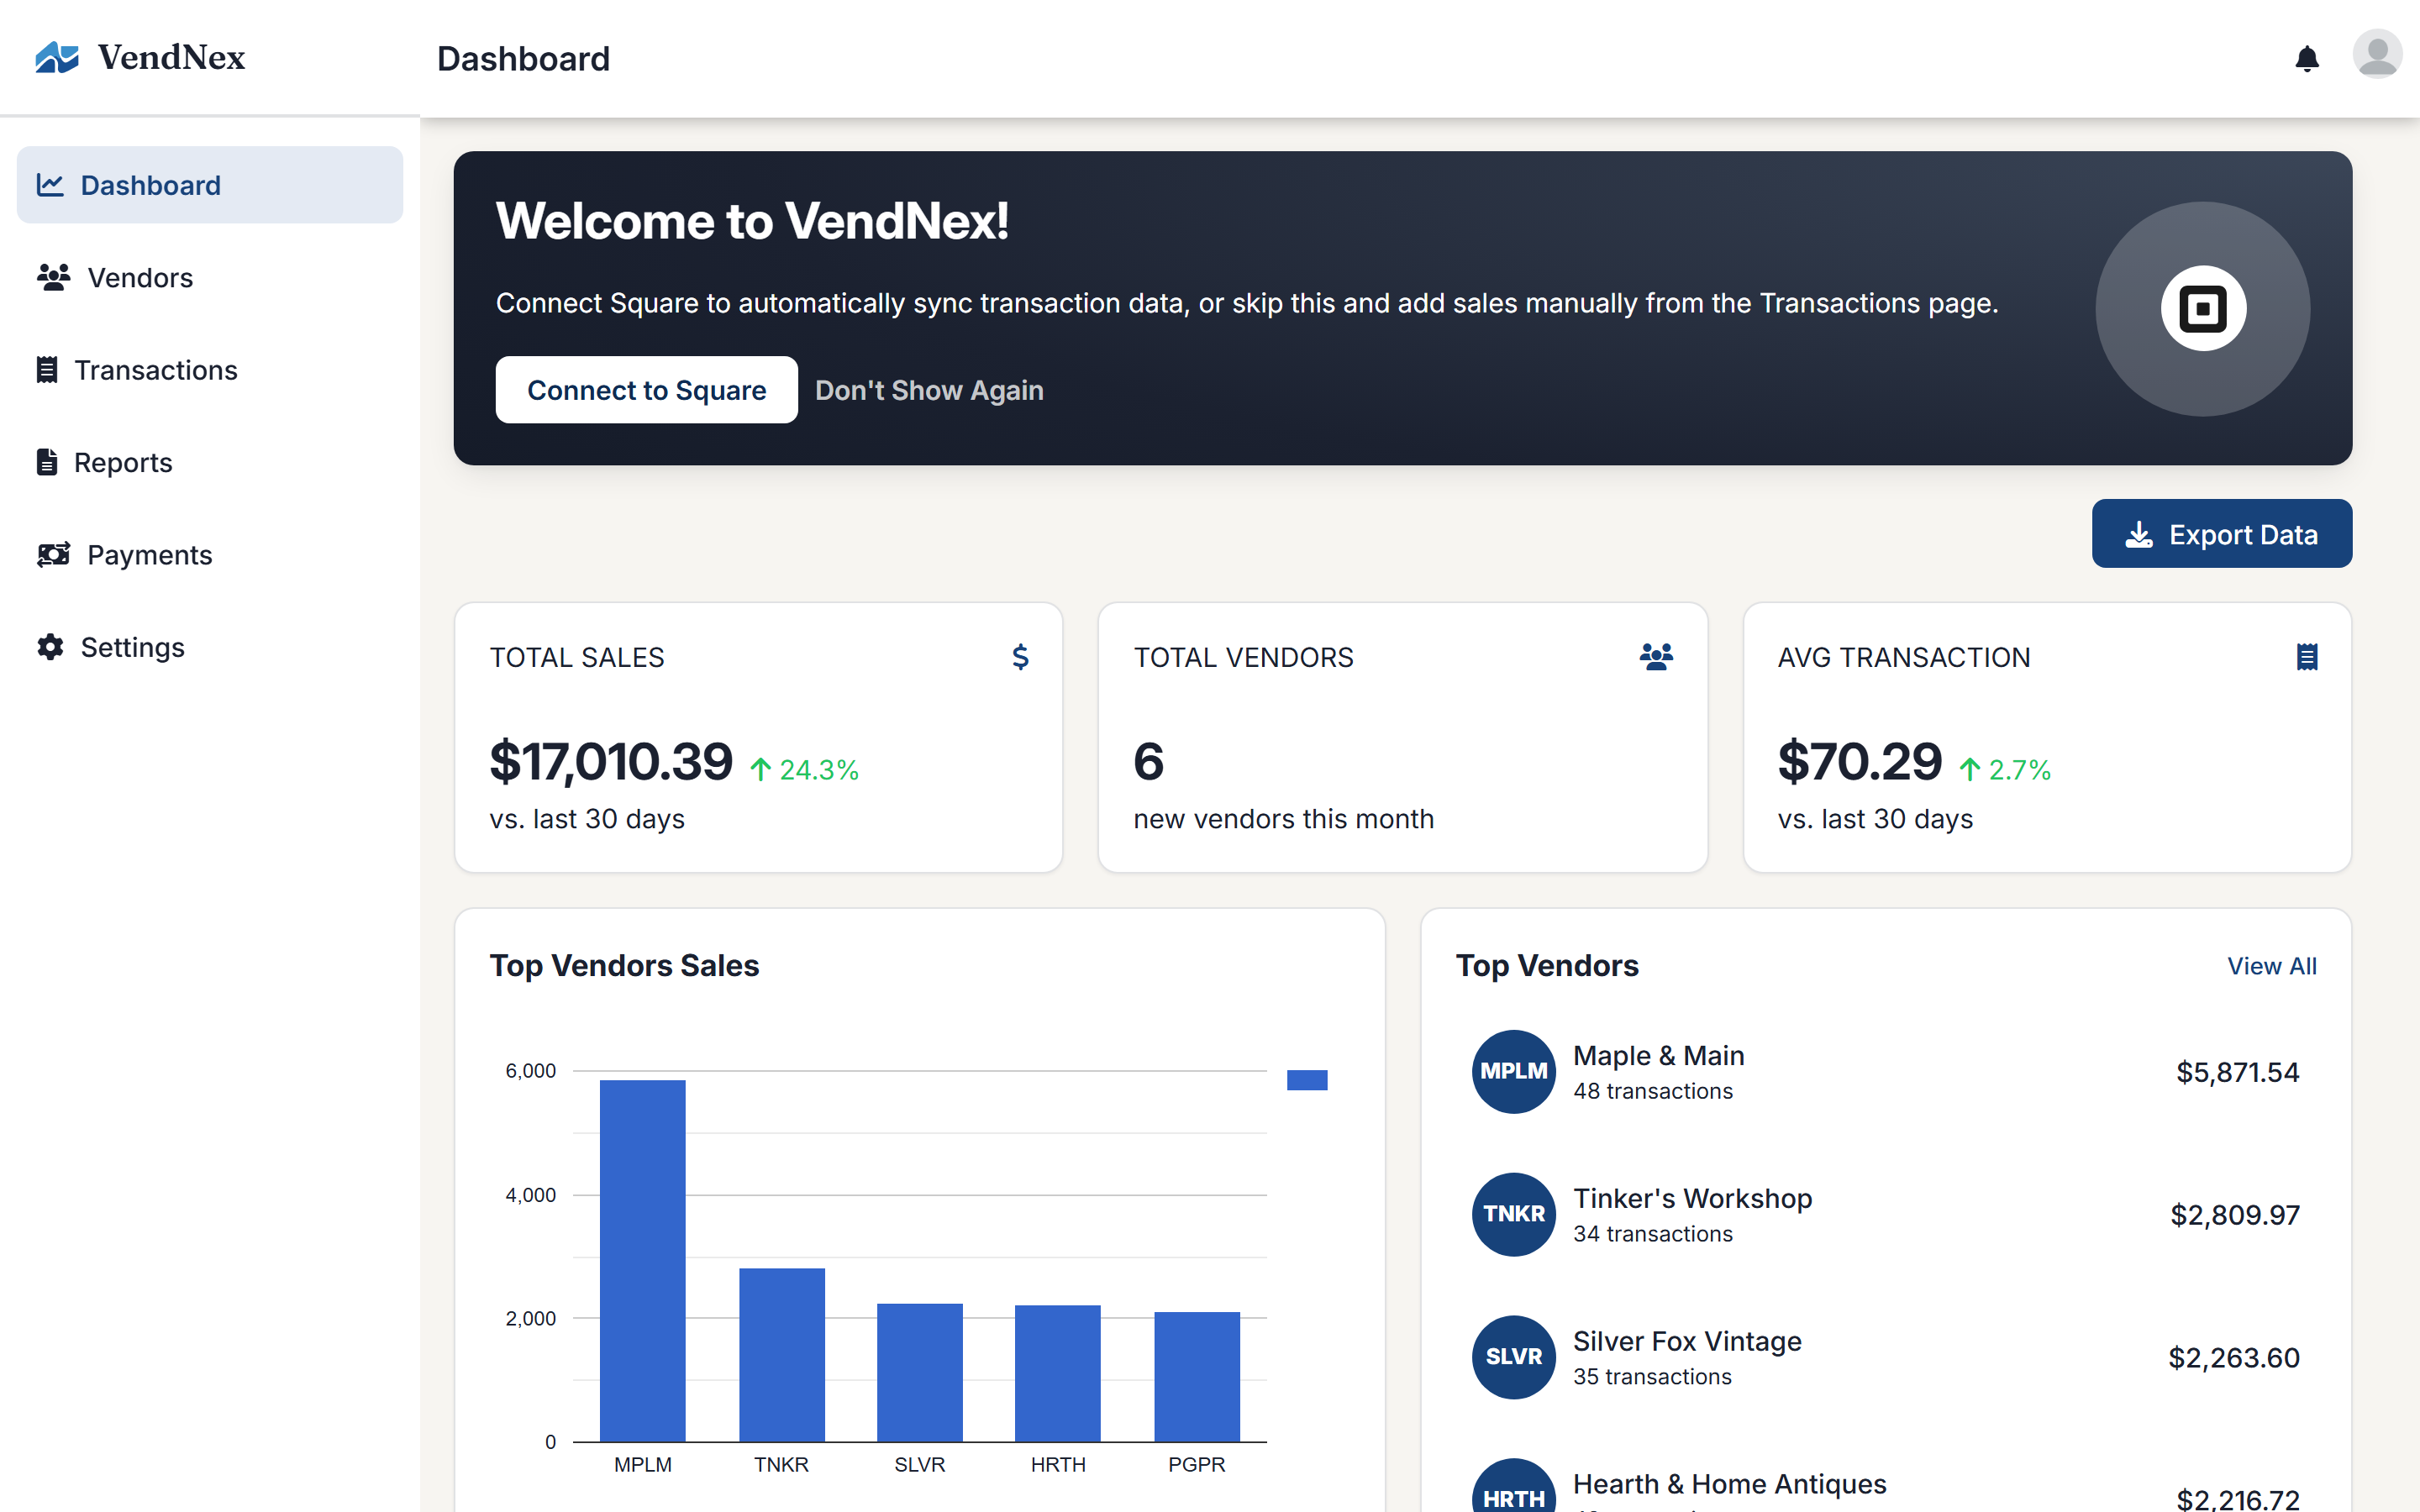
The top three cards
- Total Sales — gross sales across every vendor in the last 30 days, with the percentage change against the previous 30 days.
- Total Vendors — how many vendors you have.
- Avg Transaction — average sale amount, again over the last 30 days.
These are gross figures. They're what the shop rang up, before commission is split out.
Top Vendors
Ranks your vendors by sales for the period, with transaction counts. Useful for spotting which booths are carrying the floor and which aren't moving.
Recent Transactions
The most recent sales, whichever source they came from — Square, Shopify, or entered by hand. Click View All to open the full Transactions page.
Export Data
Exports your data for outside use, such as handing figures to a bookkeeper at year end.